Recognized by industry leaders:


Research Solutions for Wind Power


Wind Power Equipment: 2026
Building on 16 years of renewable energy market expertise, Dedalus Consulting's intelligence coverage offers the most comprehensive data and analysis available. Our published research report is in its 8th edition. This comprehensive industry report provides a detailed breakdown of the technology and market dynamics driving the global wind energy equipment sector. Quantitative and qualitative analyses are presented for the years 2024 through 2040, and the report has been completely revised and updated to present up-to-date trends and forecasts covering wind turbines, gearboxes, generators, blades, and control systems across onshore and offshore installations.
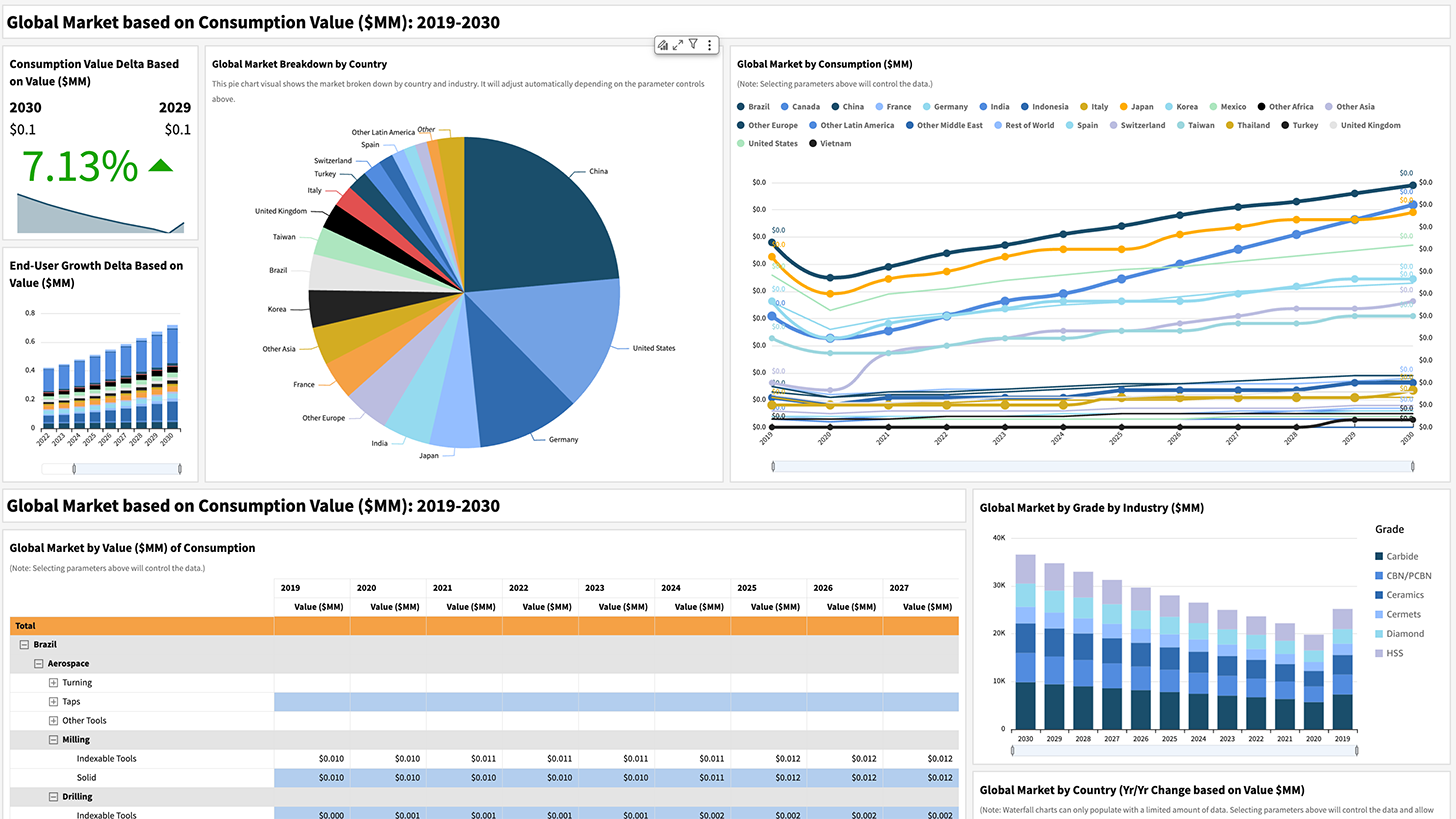
Global markets are broken down by consumption ($mm) by country, end-user segment, equipment type, turbine capacity, application, installation type, distribution channels, and competitor.
Revision Date: December 2025
Pages: 150+
Charts/Graphs: 125+
Years Covered: 2004-2024 Actual, 2025 Estimate, 2026-2040 Forecasts
Parametric Breakdowns: Year, Country, End-User Industry, Equipment Type, Turbine Capacity, Installation Type, Applications, Distribution Channels, Competitive Environment...
Companies Researched: 150+
Delivery Method: PDF or Web Viewer Depending on License
Summary of Report Contents
Our published research has been industry proven as a consistently reliable source of market intelligence for many years. Through our work publishing research reports and consulting on energy equipment markets, we have been able to offer clients valuable insights into new and existing markets.
The report contains over 150 pages and over 125 charts/graphs.
Scope of Coverage
The following categories present how the data was developed, organized and is presented. Breaking the data into specific categories is essential to analyze and draw meaningful insights. The breakdowns are designed to highlight key patterns and trends in the data, as well as to facilitate comparisons between different groups or segments.
Each section contains quantitative market data including market by consumption value (US$Millions), volume (UnitsMillions) and average selling price (US$/Unit). Data tables and visualizations include breakdowns by country, end-user industry & applications, operating frequencies, packaging and connector types, and supplier sales & market share. Data and analysis is available for the years 2024 to 2040 with actuals through 2024 and forecasts to 2040.
Research Objectives
The primary objectives in this analysis are:
- to provide clients with the tools they need to accurately assess their market opportunities and potential;
- to determine regional wind energy production capacity by year through 2024, 2030, and 2040;
- to determine the size of total market for wind energy consumption and production equipment by country, end-user industry, and application;
- to forecast future growth in each product by geographic and end-use market; and
- to assess the competitive environment within the market including supplier sales and market share by year.
Methodology & Sources
Dedalus Consulting employs all current market and competitive intelligence techniques in order to ensure comprehensive research and analysis. This includes primary and secondary research. The research methodology applies generally to all database services, published and custom research. It can also be modified to suit a project and the client’s specific objectives.
To read more about our methodology, please see our dedicated methodology page.
Equipment Types Covered
Type of Equipment Analyzed
- Turbines
- Type
- HAWT
- VAWT
- Other
- Size
- Small
- Large
- Other
- Location
- On-shore
- Off-shore
- Rotors
- Turbine Blades
- Hubs
- Pitch Control
- Mechanical Brakes
- Other
- Nacelle/Controls
- Rotor Shaft
- Brakes
- Generators
- Gearboxes
- Pitch Control
- Yaw Systems
- Other
- Towers
- Tubular Steel
- Lattice
- Guyed Pole
- Other
- Electrical and Control Systems
- Generators
- Converters
- Transformers
- Other
- Balance of Station
Geographic Coverage
- Africa
- Australia
- Brazil
- Canada
- China
- France
- Germany
- India
- Italy
- Japan
- Korea
- Mexico
- Middle East
- Russia
- Singapore
- Spain
- Sweden
- Switzerland
- Taiwan
- United Kingdom
- United States
- Other Asia/Pacific
- Other CIS
- Other EU
- Other Europe
- Other Latin America
- Rest of World
End-User Industries
- Aerospace
- Automotive
- Chemical Processing
- Communications
- Commercial
- Construction
- Defense/Military/Government
- Electronics
- Food Processing
- Machining
- Medical/Research
- Oil, Gas & Mining
- Paper & Pulp Industry
- Power Generation
- Residential
- Transportation
- Other
Timeframe
- Ulysses™ Data Subscription Service *
- Standard Package: 2024-2030
- Published Research
- 2024 base year
- 2025 estimated
- Forecasts: 2024-2030
Section One: Technology Overview
Types of Energy Defined
- Coal
- Oil
- Natural Gas
- Nuclear
- Renewable Energy
- Solar
- Wind
- Biofuels
- Hydro-electric
- Geothermal
Comparison of Types
- Efficiency
- Cost
Process of Energy Generation Using Wind Technology
- Materials
- Equipment
- Energy Generation
- Transmission & Distribution
Wind Energy Equipment Defined
- Turbines
- Type
- Horizontal Axis (HAWT)
- Upwind
- Downwind
- Shrouded
- Vertical Axis (VAWTS)
- Darrieus
- Savonius
- Flapping Panel
- Giromill
- Rotors
- Turbine Blades
- Hubs
- Pitch Control
- Mechanical Brakes
- Other
- Nacelle/Control
- Rotor Shaft
- Brakes
- Generators
- Gearboxes
- Pitch Control
- Yaw Systems
- Other
- Towers
- Tubular Steel
- Lattice
- Guyed pole
- Other
- Electrical Systems
- Generators
- Converters
- Transformers
- Other
- Balance of Station
Cost of the Wind Turbine
- Advanced Materials Used
- Lightweight/Durable Materials
- Core material
- Skin material
- Root material
- Fibers
- Other Materials
Transmission and Distribution
Technology Advancements/Research and Development
- Off-Shore R&D
- Next Generation
- Mechanical Components
- Blades
- Drive Train
Section Two: Market Overview
Executive Summary
- Factors Affecting the Demand for Wind Energy
- Trends by Product Type
- Trends by Region
- Trends by Technology
- Future Outlook: 2024-2030
Production of Wind Energy by Country (GW): 2024-2030
Global Consumption of Wind Energy by Country ($MM): 2024-2030
Global Wind Energy Added Capacity by Region, Difference in Projections– Low, Medium, High Projections (GW): 2024-2030
Global Wind Energy Added Capacity by Country – Low, Medium, High Projections (GW): 2024-2030
Global Wind Energy Cumulative Capacity by Region – Low, Medium, High Projections (GW): 2024-2030
Global Wind Energy Cumulative Capacity by Country – Low, Medium, High Projections (GW): 2015-2021
Global Wind Energy Equipment Market by Region – Low, Medium, High Projections ($MM): 2024-2030
Global Wind Energy Equipment Market by Country – Low, Medium, High Projections ($MM): 2024-2030
Global Consumption of Wind Energy by Equipment Type ($MM): 2024-2030
- Electrical Systems
- Turbines
- Mechanical Systems
- Control Systems/Nacelle
Global Wind Energy Added Capacity by End-User – Low, Medium, High Projections (GW): 2024-2030
- Industrial
- Residential
- Commercial
Global Consumption of Wind Energy by End-User (GW): 2024-2030
Global Wind Energy Equipment Market by End-User – Low, Medium, High Projections ($MM): 2024-2030
Global Wind Energy Added Capacity by Application – Low, Medium, High Projections (GW): 2024-2030
- On Shore
- Off Shore
Global Wind Energy Equipment Market by Application – Low, Medium, High Projections ($MM): 2024-2030
Competitive Environment
- Competitive Market Factors (e.g., pricing, product development...)
- Major Equipment Supplier Sales and Market Share ($MM): 2023-2024
- Marketing Strategies
- Competitive Landscape Moving Forward
Future Outlook for Wind Energy
- Demand Trends: 2024-2030
- Technological Advancement/R&D
- Social/Political Factor
Section Four: Turbines
Global Demand of Wind Turbines by Region
Global Demand of Wind Turbines by Country
Turbine Market by Construction Location
- On-Shore
- Off-Shore
Turbine Market by End-User
- Industrial
- Residential
- Commercial
Turbine Companies and Market Share
Future Outlook
Section Four: Turbines
Global Demand of Wind Turbines by Region
Global Demand of Wind Turbines by Country
Turbine Market by Construction Location
- On-Shore
- Off-Shore
Turbine Market by End-User
- Industrial
- Residential
- Commercial
Turbine Companies and Market Share
Future Outlook
Section Five: Mechanical Systems
Global Demand of Mechanical Systems by Region
Mechanical Systems Market by Type of Product
- Hubs
- Gearboxes
- Mechanical Brakes
- Other
Mechanical Systems Market by End-User
- Industrial
- Residential
- Commercial
Mechanical Systems Market by Construction Location
- On-Shore
- Off-Shore
Mechanical Systems Sales and Market Share
Future Outlook
Section Six: Control Systems
Global Demand of Control Systems by Country
Control Systems by Type of Product
- Rotor Shaft
- Brakes
- Generators
- Pitch Control
- Yaw Systems
- Other
Control Systems Market by End-User
- Industrial
- Residential
- Commercial
Sales and Market Share
Future Outlook
Section Seven: Towers
Global Demand of Towers by Region
Towers by Type Product
- Tubular Steel
- Lattice
- Guyed pole
- Other
Tower Market by End-User
- Industrial
- Residential
- Commercial
Sales and Market Share
Future Outlook
Section Eight: Balance of Systems (BOS)
Global Demand of BOS by Country
BOS by Type of Product
- Foundation
- Electrical
- Transmission Lines
- Operations and Maintenance facilities
- Shipping logistics
- Permits/Legal
- Engineering and Construction
- Other
BOS Market by End-User
- Industrial
- Residential
- Commercial
Sales and Market Share
Future Outlook
List of Tables by Section
Section One: Technology Overview
- Table 1.1 Comparison of Types of Electricity ($/kW-hr)
- Table 1.2 Comparison of Types of Electricity (% Efficiency)
- Table 1.3 Comparison of Electrical Plants Cost ($/kW)
- Table 1.4 Capital Cost/Capacity Comparison
- Table 1.5 Wind Turbine Main Components (% of cost)
Section Two: Market Overview
- Table 2.1 Global Demand of Energy by Region 2010-2040 (Quadrillion BTU)
- Table 2.1a Global Demand of Energy 2010-2040 (%)
- Table 2.2 Global Demand of Energy by Type 2010-2040 (Quadrillion BTU)
- Table 2.2a Global Demand of Energy by Type 2010-2040 (%)
- Table 2.3 Energy Demand Projections Africa by Type 2010-2040 (Quadrillion BTU)
- Table 2.3a Energy Demand Projections Africa by Type 2010-2040 (%)
- Table 2.4 Energy Demand Projections Asia by Type 2010-2040 (Quadrillion BTU)
- Table 2.4a Energy Demand Projections Asia by Type 2010-2040 (%)
- Table 2.5 Energy Demand Projections Europe by Type 2010-2040 (Quadrillion BTU)
- Table 2.5a Energy Demand Projections Europe by Type 2010-2040 (%)
- Table 2.6 Energy Demand Projections Latin America by Type 2010-2040 (Quadrillion BTU)
- Table 2.6a Energy Demand Projections Latin America by Type 2010-2040 (%)
- Table 2.7 Energy Demand Projections North America by Type 2010-2040 (Quadrillion BTU)
- Table 2.7a Energy Demand Projections North America by Type 2010-2040 (%)
- Table 2.8 Energy Demand Projections Middle East by Type 2010-2040 (Quadrillion BTU)
- Table 2.8a Energy Demand Projections Middle East by Type 2010-2040 (%)
- Table 2.9: Wind Added Capacity (GW): 2024-2030
- Table 2.9a: % Change in Projections: 2024-2030
- Table 2.10b: Wind Added Capacity (%): 2024-2030
- Table 2.10c: Wind Capacity (Yr-Yr): 2024-2030
- Table 2.11: Wind Energy Cumulative Capacity by Region (GW): 2024-2030
- Table 2.12: % Change in Projections: 2024-2030
- Table 2.12b: Wind Cumulative Capacity (%): 2024-2030
- Table 2.12c: Wind Cumulative Capacity (Yr-Yr): 2024-2030
- Table 2.13: Wind Energy Equipment Market by Region (Bn USD): 2024-2030
- Table 2.13a: % Change in Projections: 2024-2030
- Table 2.13b: Wind Energy Equipment Market (%): 2024-2030
- Table 2.13c: Wind Energy Market (Yr-Yr): 2024-2030
- Table 2.14: Wind Added Capacity by Country (GW): 2024-2030
- Table 2.14a: % Change in Projections: 2024-2030
- Table 2.14b: Added Capacity by Country (%): 2024-2030
- Table 2.14c: Added Capacity by Country (Yr-Yr): 2024-2030
- Table 2.15: Wind Cumulative Capacity by Country (GW): 2024-2030
- Table 2.15a: % Change in Projections: 2024-2030
- Table 2.15b: Cumulative Capacity by Country (%): 2024-2030
- Table 2.15c: Cumulative Capacity by Country (Yr-Yr): 2024-2030
- Table 2.16: Wind Equipment Market Country (Bn USD): 2024-2030
- Table 2.16a: % Change in Projections: 2024-2030
- Table 2.16b: Wind Energy Equipment Market by Country (%): 2024-2030
- Table 2.16c: Wind Energy Equipment Market by Country (Yr-Yr): 2024-2030
- Table 2.17: Wind Energy by End-User (GW Added Capacity): 2024-2030
- Table 2.7a: % Change in Projections: 2024-2030
- Table 2.17b: Wind Energy by End-User (%): 2024-2030
- Table 2.17c: Wind Energy by End-User (Yr-Yr): 2024-2030
- Table 2.18: Wind Energy by End-User (Bn USD): 2024-2030
- Table 2.18a: % Change in Projections: 2024-2030
- Table 2.18b: Wind Energy by End-User (%): 2024-2030
- Table 2.18c: Wind Energy by End-User (Yr-Yr): 2024-2030
- Table 2.19: Wind Energy by Application (GW): 2024-2030
- Table 2.19a: % Change in Projections: 2024-2030
- Table 2.19b: Wind Energy by Application (%): 2024-2030
- Table 2.19c: Wind Energy by Application (Yr-Yr): 2024-2030
- Table 2.20: Wind Energy by Application (Bn USD): 2024-2030
- Table 2.20a: % Change in Projections: 2024-2030
- Table 2.20b: Wind Energy by Application (%): 2024-2030
- Table 2.20c: Wind Energy by Application (Yr-Yr): 2024-2030
- Table 2.21: Total Equipment Market (Bn USD)
- Table 2.21a: Total Equipment Market (%)
Section Three: Electrical Systems
- Table 3.1: Electrical Systems by Region (Bn USD): 2024-2030
- Table 3.1a: % Change in Projections: 2024-2030
- Table 3.1b: Electrical Systems by Region (%): 2024-2030
- Table 3.1c: Electrical Systems by Region (Yr-Yr): 2024-2030
- Table 3.2: Electrical Systems by Key Country (Bn USD): 2024-2030
- Table 3.2a: % Change in Projections: 2024-2030
- Table 3.2b: Electrical Systems by Country (%): 2024-2030
- Table 3.2c: Electrical System by Country (Yr-Yr): 2024-2030
- Table 3.3: Electrical Systems by End-User (GW Added Capacity): 2024-2030
- Table 3.3a: % Change in Projections: 2024-2030
- Table 3.3b: Electrical Systems by End-User (%): 2024-2030
- Table 3.3c: Electrical System by End-User (Yr-Yr): 2024-2030
- Table 3.4: Electrical Systems by Application (Bn USD): 2024-2030
- Table 3.4a: % Change in Projections: 2024-2030
- Table 3.4b: Electrical Systems by Application (%): 2024-2030
- Table 3.4c: Electrical Systems by Application (Yr-Yr): 2024-2030
- Table 3.5: Electrical Systems by Technology (Bn USD): 2024-2030
- Table 3.5a: % Change in Projections: 2024-2030
- Table 3.5b: Electrical Systems by Technology (%): 2024-2030
- Table 3.5c: Electrical Systems by Technology (Yr-Yr): 2024-2030
- Table 3.6: Electrical Systems Sales and Market Share
Section Four: Turbines
- Table 4.1: Turbines by Type of Product (Bn USD): 2024-2030
- Table 4.1a: % Change in Projections: 2024-2030
- Table 4.1b: Turbines by Type of Product (%): 2024-2030
- Table 4.1c: Turbine by Type of Product (Yr-Yr): 2024-2030
- Table 4.2: Blades by Region (Bn USD): 2024-2030
- Table 4.2a: % Change in Projections: 2024-2030
- Table 4.2b: Blades by Region (%): 2024-2030
- Table 4.2c: Blades by Region (Yr-Yr): 2024-2030
- Table 4.3: Towers by Region (Bn USD): 2024-2030
- Table 4.3a: % Change in Projections: 2024-2030
- Table 4.3b: Towers by Region (%): 2024-2030
- Table 4.3c: Towers by Region (Yr-Yr): 2024-2030
- Table 4.4: Towers by Key Country (Bn USD): 2024-2030
- Table 4.4a: % Change in Projections: 2024-2030
- Table 4.4b: Towers by Country (%): 2024-2030
- Table 4.4c: Towers by Country (Yr-Yr): 2024-2030
- Table 4.5: Blades by Key Country (Bn USD): 2024-2030
- Table 4.5a: % Change in Projections: 2024-2030
- Table 4.5b: Blades by Country (%): 2024-2030
- Table 4.5c: Blades by Country (Yr-Yr): 2024-2030
- Table 4.6: Blades by End-User (GW Added Capacity): 2024-2030
- Table 4.6a: % Change in Projections: 2024-2030
- Table 4.6b: Blades by End-User (%): 2024-2030
- Table 4.6c: Blades by End-User (Yr-Yr): 2024-2030
- Table 4.7: Towers by End-User (GW Added Capacity): 2024-2030
- Table 4.7a: % Change in Projections: 2024-2030
- Table 4.7b: Blades by End-User (%): 2024-2030
- Table 4.7c: Blades by End-User (Yr-Yr): 2024-2030
- Table 4.8: Blades by Application (Bn USD): 2024-2030
- Table 4.8a: % Change in Projections: 2024-2030
- Table 4.8b: Blades by Application (%): 2024-2030
- Table 4.8c: Blades by Application (Yr-Yr): 2024-2030
- Table 4.9: Towers by Application (Bn USD): 2024-2030
- Table 4.9a: % Change in Projections: 2024-2030
- Table 4.9b: Towers by Application (%): 2024-2030
- Table 4.9c: Towers by Application (Yr-Yr): 2024-2030
- Table 4.10: Turbine Major Companies-Revenue and Marketshare
Section Five: Mechanical Systems
- Table 5.1: Mechanical Systems by Region (Bn USD): 2024-2030
- Table 5.1a: % Change in Projections: 2024-2030
- Table 5.1b: Mechanical by Region (%): 2024-2030
- Table 5.1c: Mechanical Systems by Region (Yr-Yr): 2024-2030
- Table 5.2: Mechanical Systems Key Country (Bn USD): 2024-2030
- Table 5.2a: % Change in Projections: 2024-2030
- Table 5.2b: Mechanical Systems by Country (%): 2024-2030
- Table 5.2c: Mechanical Systems by Country (Yr-Yr): 2024-2030
- Table 5.3: Mechanical Systems by End-User (Bn USD): 2024-2030
- Table 5.3a: % Change in Projections: 2024-2030
- Table 5.3b: Mechanical Systems by End-User (%): 2024-2030
- Table 5.3c: Mechanical Systems by End-User (Yr-Yr): 2024-2030
- Table 5.4: Mechanical Systems by Application (Bn USD): 2024-2030
- Table 5.4a: % Change in Projections: 2024-2030
- Table 5.4b: % Change in Projections: 2024-2030
- Table 5.4c: Mechanical Systems by Application (Yr-Yr): 2024-2030
- Table 5.5: Mechanical Systems by Technology (Yr-Yr): 2024-2030
- Table 5.5a: % Change in Projections: 2024-2030
- Table 5.5b: Mechanical Systems by Technology (%): 2024-2030
- Table 5.5c: Mechanical Systems by Technology (Yr-Yr): 2024-2030
- Table 5.6: Mechanical Systems Sales and Market Share
Section Six: Control Systems
- Table 6.1: Control Systems by Region (Bn USD): 2024-2030
- Table 6.1a: % Change in Projections: 2024-2030
- Table 6.1b: Control Systems by Region (%): 2024-2030
- Table 6.1c: Control Systems by Region (Yr-Yr): 2024-2030
- Table 6.2: Control Systems by Key Country (Bn USD): 2024-2030
- Table 6.2a: % Change in Projections: 2024-2030
- Table 6.2b: Control Systems by Country (%): 2024-2030
- Table 6.2c: Control Systems by Country (Yr-Yr): 2024-2030
- Table 6.3: Control Systems by End-User (Bn USD): 2024-2030
- Table 6.3a: % Change in Projections: 2024-2030
- Table 6.3b: Control Systems by End-User (%): 2024-2030
- Table 6.3c: Control Systems by End-User (Yr-Yr): 2024-2030
- Table 6.4: Control Systems by Application (Bn USD): 2024-2030
- Table 6.4a: % Change in Projections: 2024-2030
- Table 6.4b: Control Systems by Application (%): 2024-2030
- Table 6.4c: Control Systems by Application (Yr-Yr): 2024-2030
- Table 6.5: Control Systems by Technology (Bn USD): 2024-2030
- Table 6.5a: % Change in Projections: 2024-2030
- Table 6.5b: Control Systems by Technology (%): 2024-2030
- Table 6.5c: Control Systems by Technology (Yr-Yr): 2024-2030
- Table 6.6 Control Systems Companies Sales and Marketshare: 2024-2024

Ulysses™ is a dashboard-based, on-demand market intelligence platform that delivers dynamic, multi-dimensional data access rather than static reports. Built on over two decades of our trusted knowledge base and expertise, the Wind Energy Equipment database is populated by millions of data points per product group, spanning historical data from 2004 through forecasts to 2040.
The platform operates as a 24/7/365 accessible research tool that allows users to conduct custom searches across multiple variables—including country, product categories, end-user industries, and specific applications—enabling precise market analysis tailored to individual business needs. Users can seamlessly generate custom reports, export data as CSV files or excel workbooks, prepare pivot tables and visual presentations, and access both quantitative metrics and qualitative insights covering competitive analysis, market drivers, and distribution channels. The platform's scalability ensures it can adapt to different organizational requirements and budgets by offering different licenses and subscription levels while maintaining depth and reliability in quarterly updates.
Revision Date: December 2025
Datapoints: 105 Million+
Parametric Breakdowns: Year, Country, End-User Segment, Equipment Type, Turbine Capacity, Installation Type, Applications, Distribution Channels, Competitive Environment and more...
Companies Researched: 150+
Years Covered: 2004-2024 Actual, 2025 Estimate, 2026-2040 Forecasts
Delivery Method: Online Dashboards with Downloadable CSV Options Depending on License/Package

Dedalus Consulting's Data on Demand service provides fast, targeted market intelligence for organizations that need reliable data quickly and cost-effectively. This streamlined offering delivers pre-defined datasets focused on specific markets, geographies, or product categories, enabling rapid access to the essential intelligence required for time-sensitive business decisions without the investment required for comprehensive reports or full database subscriptions. Whether you're preparing a quick competitive brief, validating a market opportunity, supporting an internal presentation, or conducting preliminary due diligence, Data on Demand delivers the specific market metrics and insights you need. This flexible solution bridges the gap between broad industry overviews and exhaustive research projects, providing the strategic sweet spot for professionals who require trustworthy, independently verified market data on accelerated timelines.
Revision Date: December 2025
Datasets: 200+
Formats: XLS, CSV
Breakdowns: Year, Country, End-User Segment, Equipment Type, Turbine Capacity, Installation Type, Applications and more...
Years Covered: 2024 Actual, 2025 Estimate, 2026-2030 Forecasts

Dedalus Consulting's Market Essentials reports provide the fundamental intelligence that serves as the foundation for sound strategic planning at an accessible entry-level price point. Designed for organizations seeking core market understanding without the investment required for comprehensive multi-volume analysis, Market Essentials delivers the critical data and insights necessary to grasp industry fundamentals, competitive dynamics, and key market drivers. Each report distills decades of specialized expertise into focused analysis covering essential market sizing, major player identification, primary end-user segments, and significant trend trajectories—the cornerstones upon which effective business strategies are built. This streamlined approach makes professional-grade market intelligence accessible to smaller organizations, individual business units, or teams conducting preliminary market assessment before committing to deeper research investments.
Revision Date: December 2025
Pages: 25
Tables/Charts/Graphs: 50+
Years Covered: 2024 Actual, 2025 Estimate, 2026-2040 Forecasts
Parametric Breakdowns: Year, Country, End-User Segment, Equipment Type, Turbine Capacity, Installation Type, Applications and more...
Companies Researched: 150+
Delivery Method: PDF, Printable – Five (5) User License

Dedalus Consulting's Single-Client Consulting Services provide customized market intelligence tailored to the strategic challenges that standard research cannot address. With over 25 years of proven expertise serving manufacturers, end-users, financial institutions, and academic organizations in the wind energy equipment sector, we deliver the targeted competitive analysis essential for market expansion strategies, new product launches, regional market entry decisions, and merger and acquisition due diligence. Our consulting methodology distinguishes itself through primary research interviews with industry participants across the value chain—from manufacturers and distributors to end-users—combined with proprietary data accumulated through decades of continuous market tracking in wind power generation. This approach leverages deep industry relationships built over a quarter-century to surface operational insights and competitive intelligence that secondary research sources simply cannot provide. When standard market reports fall short of addressing your specific strategic requirements, Dedalus Consulting's Single-Client services deliver the precision intelligence that drives confident, informed business decisions in rapidly evolving technology markets.
Key Capabilities:
- Market Entry & Expansion Analysis — Comprehensive assessment of regional opportunities, competitive landscapes, distribution channel requirements, and go-to-market strategies tailored to specific geographic or segment expansion objectives
- Merger & Acquisition Due Diligence — In-depth target company evaluation including market position validation, competitive threat assessment, customer relationship analysis, and strategic fit evaluation backed by primary research and proprietary market data
- New Product Launch Intelligence — Market readiness assessment, competitive response forecasting, pricing strategy development, and distribution channel optimization to maximize launch success and accelerate market penetration
- Competitive Benchmarking & Strategic Positioning — Detailed analysis of competitor capabilities, market share dynamics, differentiation strategies, and vulnerabilities to identify sustainable competitive advantages and strategic opportunities
- Supply Chain & Sourcing Strategy — Comprehensive supplier landscape mapping, alternative sourcing identification, supply chain risk assessment, and strategic procurement intelligence leveraging deep industry relationships and market knowledge

Dedalus Consulting's Competitive Profiles deliver comprehensive intelligence on key industry players in the wind energy equipment market, providing the detailed competitive analysis essential for strategic positioning, M&A due diligence, and market entry decisions. Each profile offers an in-depth examination of a company's competitive standing within the wind power generation industry, combining quantitative performance metrics with qualitative strategic assessment to reveal competitive strengths, vulnerabilities, and market trajectories. Our analyses include detailed breakdowns of sales performance and market share by product type, geographic region, and end-user segment, alongside examination of distribution channel strategies, manufacturing capabilities, technology portfolios, and go-to-market approaches. Key performance indicators cover revenue trends, profitability metrics, capacity utilization, R&D investment patterns, and product mix evolution, while competitive positioning analysis evaluates differentiation strategies, pricing power, customer relationships, and supply chain advantages.
Key Intelligence Components:
- Sales Performance & Market Share Analysis — Detailed revenue breakdowns by product line, geographic region, end-user segment, and distribution channel, with historical trends and market share positioning across specific industrial segments
- Strategic Positioning Assessment — Comprehensive evaluation of competitive differentiation strategies, pricing power, technology portfolios, manufacturing capabilities, and go-to-market approaches that define each company's competitive advantage
- Distribution & Channel Strategy Analysis — In-depth examination of sales channel mix, distributor relationships, direct sales capabilities, customer service infrastructure, and route-to-market effectiveness across geographic markets
- Financial & Operational Metrics — Key performance indicators including revenue trends, profitability analysis, capacity utilization, R&D investment patterns, product mix evolution, and operational efficiency benchmarks validated through primary research
- Competitive Strengths & Vulnerabilities — Strategic intelligence on management capabilities, innovation pipelines, customer relationships, supply chain advantages, technology gaps, and market positioning weaknesses that impact long-term competitive sustainability
