Recognized by industry leaders:


Research Solutions for Germanium


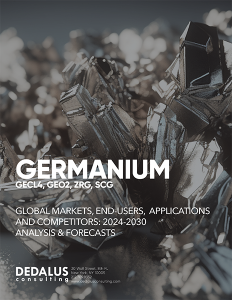
Germanium: 2026
Our 22 years of specialized research in specialty materials and semiconductor industries positions Dedalus Consulting as the leading intelligence provider for comprehensive market data and analysis. Our published research report is in its 8th edition. This comprehensive industry report provides a detailed breakdown of the technology and market dynamics driving the global germanium sector. Quantitative and qualitative analyses are presented for the years 2024 through 2040, and the report has been completely revised and updated to present up-to-date trends and forecasts covering applications in fiber optics, infrared optics, and semiconductor substrates.
Global markets are broken down by consumption ($mm) and volume by country, end-user industry, application type, purity grade, form factor, distribution channels, and competitor.
Revision Date: December 2025
Pages: 150+
Charts/Graphs: 125+
Years Covered: 2004-2024 Actual, 2025 Estimate, 2026-2040 Forecasts
Parametric Breakdowns: Year, Country, End-User Industry, Product Type, Purity Grade, Form Factor, Applications, Distribution Channels, Competitive Environment...
Companies Researched: 150+
Delivery Method: PDF or Web Viewer Depending on License
Summary of Report Contents
Products Covered
- Germanium Compounds and Products
- Germanium Tetrachloride(GeCl4)
- Germanium Dioxide (GeO2)
- Zone-Refined Germanium (ZRG)
- Single Crystal Germanium (SCG)
Sources of Germanium Materials and Products
- Obtaining Germanium Raw Material, Compound Materials and Products
World Market for Germanium Materials and Germanium-based Products
- Industry Overview
- General Market Trends Affecting Supply and Demand
- Supply/Value Chain Generally
- Distribution Channels
- System of Contracts Generally
- Global Production of Germanium Materials
- Value
- Volume
- Pricing
- Global Demand for Ge Materials
- Value/Volume
- Pricing
Substitutes for Germanium and Competitive Elements
Market for GeCl4
- Market Overview
- Supply/Value Chain
- Distribution Channels
- System of Contracts/Pricing
- Global Production of GeCl4
- Value
- Volume
- Pricing
- Global Demand for GeCL4
- Value
- Volume
- Pricing
Market for Ge02
- Market Overview
- Supply/Value Chain
- Distribution Channels
- System of Contracts/Pricing
- Regulatory Environment
- Global Production of Ge02
- Value
- Volume
- Global Demand for GeCL4
- Value
- Volume
- Pricing
Market for Zone-Refined Germanium (ZRG)
- Market Overview
- Supply/Value Chain
- Distribution Channels
- System of Contracts/Pricing
- Global Production of Zone-Refined Germanium (ZRG)
- Value
- Volume
- Global Demand for GeCL4
- Value
- Volume
- Pricing
Market for Single Crystal Germanium (SCG)
- Market Overview
- Supply/Value Chain
- Distribution Channels
- System of Contracts/Pricing
- Global Production of GeCl4
- Value
- Volume
- Pricing
- Global Demand for GeCL4
- Value
- Volume
- Pricing
Competitive Environment
- Competitive Factors in the Raw Materials Sector
Challenges Facing the Ge Industry
- Trends/Analysis in Production and Consumption
- Breakdown by Country ($, Kg, ASP)
- Breakdown by End-User ($, Kg, ASP)
- Breakdown by Supplier ($, Kg, ASP)
- Competitive Substitutes
- Silicon Solar Cell Wafers
- II-VI Optical Materials
- Other Challenges
- Supply/International Trade Barriers
- Regulatory Environment
Section Two: Major End-Use markets
Introduction
Applications
- Current and New Uses of Ge
- Detailed Application Chart of All Uses of Ge: 2009, 2018
Brief Overview of Each End-User Industry
- IR Optics
- Solar Cells
- Fiber Optics
- Catalysts
- Polymers
- Phosphors
- Electronics
- Communications
- Other
Production Analysis by Ge Product Type
- Supply Chain Analysis by End-User
Demand of Ge Materials
- Value Chain Analysis by End-User
- End-User Criteria for Product Selection
Competitive Advantages of Ge Products as Compared with Existing Analogs by Ge Type and End-User Industry
Historic, Current and Projected Industry Size and Growth Rates
Drivers for Industry Growth
- Government, Military and Commercial Programs
- e.g., ICAR and ICU programs in Automotive
Supply Chain for Ge in IR Optics
- Major Trends and Analysis by Country
Market Dynamics
- System of Contracts: Spot versus Long-Term Supply Agreements
- Pricing Mechanisms
Value Chain Analysis
- Sources of Raw Materials
- Shipping and Logistics
- Distribution Model
–Margins at Each Stage
End-User Analysis
- Key End-Users
–Percent of Demand
- Other Major Customers
Competitive Environment
- General Competitive Trends
- Competitive Factors in Materials Production
- Key Suppliers of Ge
- General Competitive Trends
- Competitive Factors in Materials Production
- Other Major Suppliers
Competitive Analysis
Section Three: Gecl4
World GeCl4 Demand by End-User
- Value
- End-User Trends
- Volume
- Pricing
Section Four: GeO2
World Ge02 Demand by End-User
- Ge02 Applications
- Value
- Volume
- Pricing
Section Five: ZRG
World ZRG Demand by End-User
- Value
- Volume
- Pricing
Section Six: SCG
World SCG Demand by End-User
- Value
- End-User Trends
- Volume
- Pricing
Section Seven: Porter’s Five Force’s Analysis
Introduction
Factors Affecting Competition
- Industry Concentration
- Competitive Model Formulation
- Intensity of Competition
Threat of Substitutes
Buyer Power
Supplier Power
Barriers to Entry/Threat of Entry
Section Eight: Producer Profiles
Each Company Profile includes information on their Background and Products, Technologies, Business Model, Volume of Sales, Production Capacity, Employees, Manufacturing, and Marketing Strategy and Plans)
- Applied Materials, Inc. (USA)
- Asturiana De Zinc SA (Spain)
- Chemical and Technical Developments Ltd. (UK)
- Gelest, Inc. (USA)
- Ge Corporation of America (USA)
- GFI Advanced Technologies, Inc. (USA)
- Lattice Materials Corporation (USA)
- Metaleurop SA (France)
- N.V. Umicore SA (Belgium)
- Novotech, Inc. (USA)
- Russia FSUE ‘Ge’ (Russia)
- Teck Cominco Limited (Canada)
- Yunnan Chihong Zinc-Ge Co., Ltd. (China)
- AXT (USA)
- Jenoptik (Photonic Sense) (Germany)
- Nanjing Ge Co. (China)
- Ophir Optronics Solutions (Israel, USA)
- Xilinguol Tongli Ge Refine Co. (China)
Section Nine: Local Market Perspective
Countries: USA, Germany, China, France, France, Russia, Canada, Belgium, Rest of World
Key questions:
- Raw Materials Base
- Trends in Production and Consumption by Type
- Factors Affecting Demand By Country
- Past, Current & Future Analysis of Ge Prices by Type
- Past, Current & Future Analysis of Ge Volume of Sales by Type
- Recent Past, Current & Future Analysis of Ge by End-Use Markets
List of Tables by Section
Section Tables
- Table 1.1: World Ge Production by Type ($MM): 2024-2030
- Table 1.2: World Ge Production by Type (%): 2024-2030
- Table 1.3: World Ge Production Year-over-Year Change by Type (%): 2024-2030
- Table 1.4: World Ge Production by Type (Kg): 2024-2030
- Table 1.5: World Ge Production by Type (%): 2024-2030
- Table 1.6: World Ge Production Year-over-Year Change by Type (%): 2024-2030
- Table 1.7: World Ge Pricing by Type ($/Kg): 2024-2030
- Table 1.8: World Ge Pricing Year-over-Year Change by Type (%): 2024-2030
- Table 1.9: World Ge Demand by Type ($MM): 2024-2030
- Table 1.10: World Ge Demand by Type (%): 2024-2030
- Table 1.11: World Ge Demand Year-over-Year Change by Type (%): 2024-2030
- Table 1.12: World Ge Demand by Type (Kg): 2024-2030
- Table 1.13: World Ge Demand by Type (%): 2024-2030
- Table 1.14: World Ge Demand Year-over-Year Change by Type (%): 2024-2030
- Table 1.15: World Ge Pricing by Type ($/Kg): 2024-2030
- Table 1.16: World Ge Pricing Year-over-Year Change by Type (%): 2024-2030
- Table 1.17: World Ge Production by Region ($MM): 2024-2030
- Table 1.18: World Ge Production by Region (%): 2024-2030
- Table 1.19: World Ge Production Year-over-Year Change by Region (%): 2024-2030
- Table 1.20: World Ge Production by Region (Kg): 2024-2030
- Table 1.21: World Ge Production by Region (%): 2024-2030
- Table 1.22: World Ge Production Year-over-Year Change by Region (%): 2024-2030
- Table 1.23: World Ge Pricing by Region ($/Kg): 2024-2030
- Table 1.24: World Ge Pricing Year-over-Year Change by Region (%): 2024-2030
- Table 1.25: World Ge Demand by Region ($MM): 2024-2030
- Table 1.26: World Ge Demand by Region (%): 2024-2030
- Table 1.27: World Ge Demand Year-over-Year Change by Region (%): 2024-2030
- Table 1.28: World Ge Demand by Region (Kg): 2024-2030
- Table 1.29: World Ge Demand by Region (%): 2024-2030
- Table 1.30: World Ge Demand Year-over-Year Change by Region (%): 2024-2030
- Table 1.31: World Ge Pricing by Region ($/Kg): 2024-2030
- Table 1.32: World Ge Pricing Year-over-Year Change by Region (%): 2024-2030
- Table 1.33: World GeCl4 Production by Region ($MM): 2024-2030
- Table 1.34: World GeCl4 Production by Region (%): 2024-2030
- Table 1.35: World GeCl4 Production Year-over-Year Change by Region (%): 2024-2030
- Table 1.36: World GeCl4 Production by Region (Kg): 2024-2030
- Table 1.37: World GeCl4 Production by Region (%): 2024-2030
- Table 1.38: World GeCl4 Production Year-over-Year Change by Region (%): 2024-2030
- Table 1.39: World GeCl4 Pricing by Region ($/Kg): 2024-2030
- Table 1.40: World GeCl4 Pricing Year-over-Year Change by Region (%): 2024-2030
- Table 1.41: World GeCl4 Demand by Region ($MM): 2024-2030
- Table 1.42: World GeCl4 Demand by Region (%): 2024-2030
- Table 1.43: World GeCl4 Demand Year-over-Year Change by Region (%): 2024-2030
- Table 1.44: World GeCl4 Demand by Region (Kg): 2024-2030
- Table 1.45: World GeCl4 Demand by Region (%): 2024-2030
- Table 1.46: World GeCl4 Demand Year-over-Year Change by Region (%): 2024-2030
- Table 1.47: World GeCl4 Pricing by Region ($/Kg): 2024-2030
- Table 1.48: World GeCl4 Pricing Year-over-Year Change by Region (%): 2024-2030
- Table 1.49: World GeO2 Production by Region ($MM): 2024-2030
- Table 1.50: World GeO2 Production by Region (%): 2024-2030
- Table 1.51: World GeO2 Production Year-over-Year Change by Region (%): 2024-2030
- Table 1.52: World GeO2 Production by Region (Kg): 2024-2030
- Table 1.53: World GeO2 Production by Region (%): 2024-2030
- Table 1.54: World GeO2 Production Year-over-Year Change by Region (%): 2024-2030
- Table 1.55: World GeO2 Pricing by Region ($/Kg): 2024-2030
- Table 1.56: World GeO2 Pricing Year-over-Year Change by Region (%): 2024-2030
- Table 1.57: World GeO2 Demand by Region ($MM): 2024-2030
- Table 1.58: World GeO2 Demand by Region (%): 2024-2030
- Table 1.59: World GeO2 Demand Year-over-Year Change by Region (%): 2024-2030
- Table 1.60: World GeO2 Demand by Region (Kg): 2024-2030
- Table 1.61: World GeO2 Demand by Region (%): 2024-2030
- Table 1.62: World GeO2 Demand Year-over-Year Change by Region (%): 2024-2030
- Table 1.63: World GeO2 Pricing by Region ($/Kg): 2024-2030
- Table 1.64: World GeO2 Pricing Year-over-Year Change by Region (%): 2024-2030
- Table 1.65: World Zone Refined Germanium (ZRG) Production by Region ($MM): 2024-2030
- Table 1.66: World Zone Refined Germanium (ZRG) Production by Region (%): 2024-2030
- Table 1.67: World Zone Refined Germanium (ZRG) Production Year-over-Year Change by Region (%): 2024-2030
- Table 1.68: World Zone Refined Germanium (ZRG) Production by Region (Kg): 2024-2030
- Table 1.69: World Zone Refined Germanium (ZRG) Production by Region (%): 2024-2030
- Table 1.70: World Zone Refined Germanium (ZRG) Production Year-over-Year Change by Region (%): 2024-2030
- Table 1.71: World Zone Refined Germanium (ZRG) Pricing by Region ($/Kg): 2024-2030
- Table 1.72: World Zone Refined Germanium (ZRG) Pricing Year-over-Year Change by Region (%): 2024-2030
- Table 1.73: World Zone Refined Germanium (ZRG) Demand by Region ($MM): 2024-2030
- Table 1.74: World Zone Refined Germanium (ZRG) Demand by Region (%): 2024-2030
- Table 1.75: World Zone Refined Germanium (ZRG) Demand Year-over-Year Change by Region (%): 2024-2030
- Table 1.76: World Zone Refined Germanium (ZRG) Demand by Region (Kg): 2024-2030
- Table 1.77: World Zone Refined Germanium (ZRG) Demand by Region (%): 2024-2030
- Table 1.78: World Zone Refined Germanium (ZRG) Demand Year-over-Year Change by Region (%): 2024-2030
- Table 1.79: World Zone Refined Germanium (ZRG) Pricing by Region ($/Kg): 2024-2030
- Table 1.80: World Zone Refined Germanium (ZRG) Pricing Year-over-Year Change by Region (%): 2024-2030
- Table 1.81: World Single Crystal Germanium (SCG) Production by Region ($MM): 2024-2030
- Table 1.82: World Single Crystal Germanium (SCG) Production by Region (%): 2024-2030
- Table 1.83: World Single Crystal Germanium (SCG) Production Year-over-Year Change by Region (%): 2024-2030
- Table 1.84: World Single Crystal Germanium (SCG) Production by Region (Kg): 2024-2030
- Table 1.85: World Single Crystal Germanium (SCG) Production by Region (%): 2024-2030
- Table 1.86: World Single Crystal Germanium (SCG) Production Year-over-Year Change by Region (%): 2024-2030
- Table 1.87: World Single Crystal Germanium (SCG) Pricing by Region ($/Kg): 2024-2030
- Table 1.88: World Single Crystal Germanium (SCG) Pricing Year-over-Year Change by Region (%): 2024-2030
- Table 1.89: World Single Crystal Germanium (SCG) Demand by Region ($MM): 2024-2030
- Table 1.90: World Single Crystal Germanium (SCG) Demand by Region (%): 2024-2030
- Table 1.91: World Single Crystal Germanium (SCG) Demand Year-over-Year Change by Region (%): 2024-2030
- Table 1.92: World Single Crystal Germanium (SCG) Demand by Region (Kg): 2024-2030
- Table 1.93: World Single Crystal Germanium (SCG) Demand by Region (%): 2024-2030
- Table 1.94: World Single Crystal Germanium (SCG) Demand Year-over-Year Change by Region (%): 2024-2030
- Table 1.95: World Single Crystal Germanium (SCG) Pricing by Region ($/Kg): 2024-2030
- Table 1.96: World Single Crystal Germanium (SCG) Pricing Year-over-Year Change by Region (%): 2024-2030
- Table 2.1: Germanium Materials End-Use Market (Kg): 2008
- Table 2.2: Germanium Products by End-Use Market ($MM): 2008
- Table 2.3: World Germanium Materials Demand by End-User ($MM): 2024-2030
- Table 2.4: World Germanium Materials Demand by End-User (%): 2024-2030
- Table 2.5: World Germanium Materials Demand Year-over-Year Change by End-User (%): 2024-2030
- Table 2.6: World Germanium Materials Demand by End-User (Kg): 2024-2030
- Table 2.7: World Germanium Materials Demand by End-User (%): 2024-2030
- Table 2.8: World Germanium Materials Demand Year-over-Year Change by End-User (%): 2024-2030
- Table 2.9: World Germanium Materials Pricing by End-User ($/Kg): 2024-2030
- Table 2.10: World Germanium Materials Pricing Year-over-Year Change by End-User (%): 2024-2030
- • Table 3.1: World GeCl4 Demand by End-User ($MM): 2024-2030
- Table 3.2: World GeCl4 Demand by End-User (%): 2024-2030
- Table 3.3: World GeCl4 Demand Year-over-Year Change by End-User (%): 2024-2030
- Table 3.4: World GeCl4 Demand by End-User (Kg): 2024-2030
- Table 3.5: World GeCl4 Demand by End-User (%): 2024-2030
- Table 3.6: World GeCl4 Demand Year-over-Year Change by End-User (%): 2024-2030
- Table 3.7: World GeCl4 Pricing by End-User ($/Kg): 2024-2030
- Table 3.8: World GeCl4 Pricing Year-over-Year Change by End-User (%): 2024-2030
- • Table 4.1: World GeO2 Demand by End-User ($MM): 2024-2030
- Table 4.2: World GeO2 Demand by End-User (%): 2024-2030
- Table 4.3: World GeO2 Demand Year-over-Year Change by End-User (%): 2024-2030
- Table 4.4: World GeO2 Demand by End-User (Kg): 2024-2030
- Table 4.5: World GeO2 Demand by End-User (%): 2024-2030
- Table 4.6: World GeO2 Demand Year-over-Year Change by End-User (%): 2024-2030
- Table 4.7: World GeO2 Pricing by End-User ($Kg): 2024-2030
- Table 4.8: World GeO2 Pricing Year-over-Year Change by End-User (%): 2024-2030
- Table 5.1: World Zone Refined Germanium (ZRG) Demand by End-User ($MM): 2024-2030
- Table 5.2: World Zone Refined Germanium (ZRG) Demand by End-User (%): 2024-2030
- Table 5.3: World Zone Refined Germanium (ZRG) Demand Year-over-Year Change by End-User (%): 2024-2030
- Table 5.4: World Zone Refined Germanium (ZRG) Demand by End-User (Kg): 2024-2030
- Table 5.5: World Zone Refined Germanium (ZRG) Demand by End-User (%): 2024-2030
- Table 5.6: World Zone Refined Germanium (ZRG) Demand Year-over-Year Change by End-User (%): 2024-2030
- Table 5.7: World Zone Refined Germanium (ZRG) Pricing by End-User ($/Units): 2024-2030
- Table 5.8: World Zone Refined Germanium (ZRG) Pricing Year-over-Year Change by End-User (%): 2024-2030
- Table 6.1: World Single Crystal Germanium (SCG) Demand by End-User ($MM): 2024-2030
- Table 6.2: World Single Crystal Germanium (SCG) Demand by End-User (%): 2024-2030
- Table 6.3: World Single Crystal Germanium (SCG) Demand Year-over-Year Change by End-User (%): 2024-2030
- Table 6.4: World Single Crystal Germanium (SCG) Demand by End-User (Kg): 2024-2030
- Table 6.5: World Single Crystal Germanium (SCG) Demand by End-User (%): 2024-2030
- Table 6.6: World Single Crystal Germanium (SCG) Demand Year-over-Year Change by End-User (%): 2024-2030
- Table 6.7: World Single Crystal Germanium (SCG) Pricing by End-User ($/Kg): 2024-2030
- Table 6.8: World Single Crystal Germanium (SCG) Pricing Year-over-Year Change by End-User (%): 2024-2030
- Table 9.1: World Germanium Materials End-User Markets by Country (Kg): 2008
- Table 9.2: US Ge Demand by Type ($MM): 2024-2030
- Table 9.3: US Ge Demand by Type (%): 2024-2030
- Table 9.4: US Ge Demand Year-over-Year Change by Type (%): 2024-2030
- Table 9.5: US Ge Demand by Type (Kg): 2024-2030
- Table 9.6: US Ge Demand by Type (%): 2024-2030
- Table 9.7: US Ge Demand Year-over-Year Change by Type (%): 2024-2030
- Table 9.8: US Ge Pricing by Type ($/Kg): 2024-2030
- Table 9.9: US Ge Pricing Year-over-Year Change by Type (%): 2024-2030
- Table 9.10: Germany Ge Demand by Type ($MM): 2024-2030
- Table 9.11: Germany Ge Demand by Type (%): 2024-2030
- Table 9.12: Germany Ge Demand Year-over-Year Change by Type (%): 2024-2030
- Table 9.13: Germany Ge Demand by Type (Kg): 2024-2030
- Table 9.14: Germany Ge Demand by Type (%): 2024-2030
- Table 9.15: Germany Ge Demand Year-over-Year Change by Type (%): 2024-2030
- Table 9.16: Germany Ge Pricing by Type ($/Kg): 2024-2030
- Table 9.17: Germany Ge Pricing Year-over-Year Change by Type (%): 2024-2030
- Table 9.18: China Ge Demand by Type ($MM): 2024-2030
- Table 9.19: China Ge Demand by Type (%): 2024-2030
- Table 9.20: China Ge Demand Year-over-Year Change by Type (%): 2024-2030
- Table 9.21: China Ge Demand by Type (Kg): 2024-2030
- Table 9.22: China Ge Demand by Type (%): 2024-2030
- Table 9.23: China Ge Demand Year-over-Year Change by Type (%): 2024-2030
- Table 9.24: China Ge Pricing by Type ($/Kg): 2024-2030
- Table 9.25: China Ge Pricing Year-over-Year Change by Type (%): 2024-2030
- Table 9.27: France Ge Demand by Type (%): 2024-2030
- Table 9.28: France Ge Demand Year-over-Year Change by Type (%): 2024-2030
- Table 9.29: France Ge Demand by Type (Kg): 2024-2030
- Table 9.30: France Ge Demand by Type (%): 2024-2030
- Table 9.31: France Ge Demand Year-over-Year Change by Type (%): 2024-2030
- Table 9.32: France Ge Pricing by Type ($/Kg): 2024-2030
- Table 9.33: France Ge Pricing Year-over-Year Change by Type (%): 2024-2030
- Table 9.34: Russia Ge Demand by Type ($MM): 2024-2030
- Table 9.35: Russia Ge Demand by Type (%): 2024-2030
- Table 9.36: Russia Ge Demand Year-over-Year Change by Type (%): 2024-2030
- Table 9.37: Russia Ge Demand by Type (Kg): 2024-2030
- Table 9.38: Russia Ge Demand by Type (%): 2024-2030
- Table 9.39: Russia Ge Demand Year-over-Year Change by Type (%): 2024-2030
- Table 9.40: Russia Ge Pricing by Type ($/Kg): 2024-2030
- Table 9.41: Russia Ge Pricing Year-over-Year Change by Type (%): 2024-2030
- Table 9.42: Canada Ge Demand by Type ($MM): 2024-2030
- Table 9.43: Canada Ge Demand by Type (%): 2024-2030
- Table 9.44: Canada Ge Demand Year-over-Year Change by Type (%): 2024-2030
- Table 9.45: Canada Ge Demand by Type (Kg): 2024-2030
- Table 9.46: Canada Ge Demand by Type (%): 2024-2030
- Table 9.47: Canada Ge Demand Year-over-Year Change by Type (%): 2024-2030
- Table 9.48: Canada Ge Pricing by Type ($/Kg): 2024-2030
- Table 9.49: Canada Ge Pricing Year-over-Year Change by Type (%): 2024-2030
- Table 9.50: Belgium Ge Demand by Type ($MM): 2024-2030
- Table 9.51: Belgium Ge Demand by Type (%): 2024-2030
- Table 9.52: Belgium Ge Demand Year-over-Year Change by Type (%): 2024-2030
- Table 9.53: Belgium Ge Demand by Type (Kg): 2024-2030
- Table 9.54: Belgium Ge Demand by Type (%): 2024-2030
- Table 9.55: Belgium Ge Demand Year-over-Year Change by Type (%): 2024-2030
- Table 9.56: Belgium Ge Pricing by Type ($/Kg): 2024-2030
- Table 9.57: Belgium Ge Pricing Year-over-Year Change by Type (%): 2024-2030
- Table 9.58: Rest of World Ge Demand by Type ($MM): 2024-2030
- Table 9.59: Rest of World Ge Demand by Type (%): 2024-2030
- Table 9.60: Rest of World Ge Demand Year-over-Year Change by Type (%): 2024-2030
- Table 9.61: Rest of World Ge Demand by Type (Kg): 2024-2030
- Table 9.62: Rest of World Ge Demand by Type (%): 2024-2030
- Table 9.63: Rest of World Ge Demand Year-over-Year Change by Type (%): 2024-2030
- Table 9.64: Rest of World Ge Pricing by Type ($/Kg): 2024-2030
- Table 9.65: Rest of World Ge Pricing Year-over-Year Change by Type (%): 2024-2030
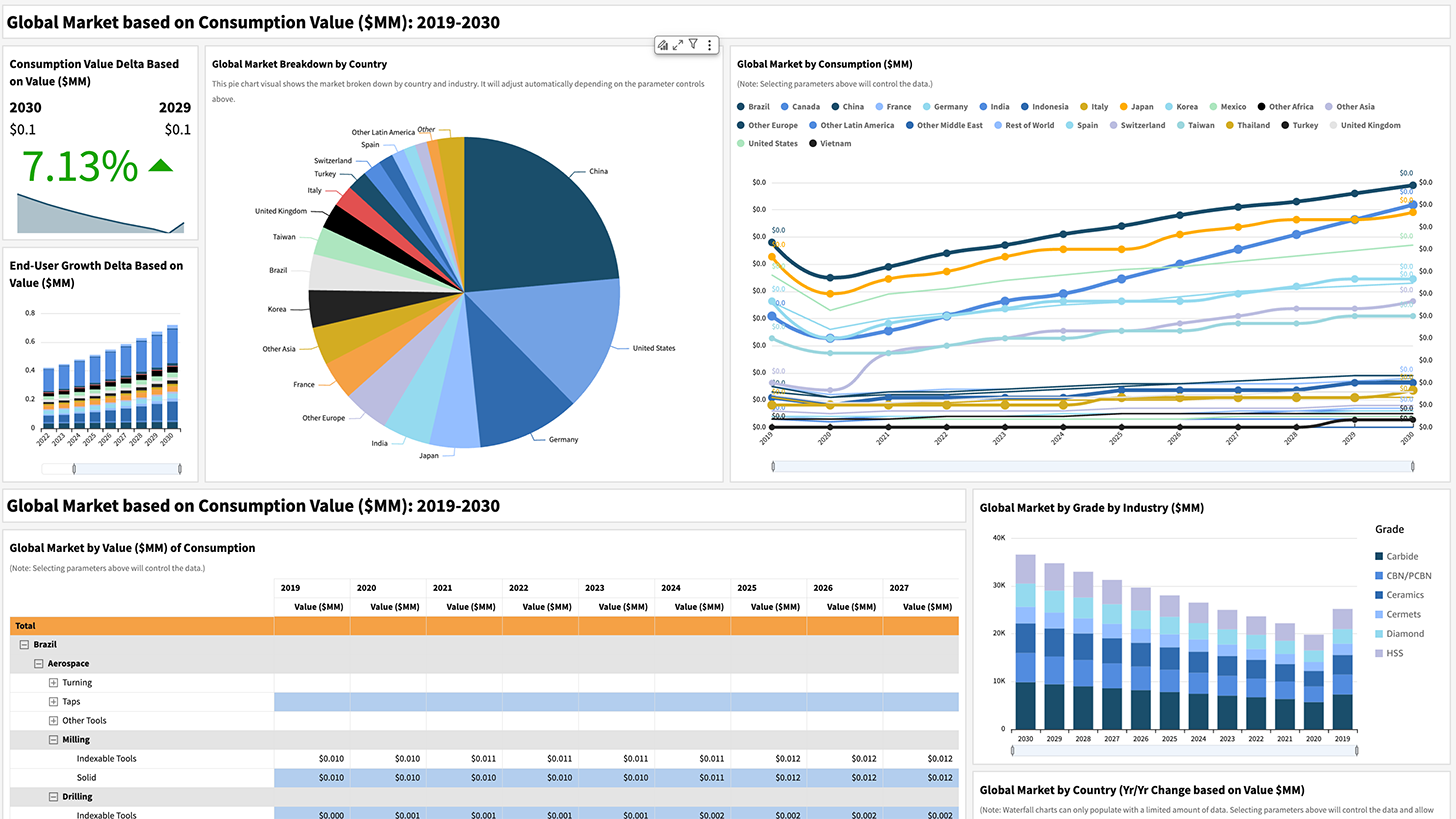
Ulysses™ is a dashboard-based, on-demand market intelligence platform that delivers dynamic, multi-dimensional data access rather than static reports. Built on over two decades of our trusted knowledge base and expertise, the Germanium database is populated by millions of data points per product group, spanning historical data from 2004 through forecasts to 2040.
The platform operates as a 24/7/365 accessible research tool that allows users to conduct custom searches across multiple variables—including country, product categories, end-user industries, and specific applications—enabling precise market analysis tailored to individual business needs. Users can seamlessly generate custom reports, export data as CSV files or excel workbooks, prepare pivot tables and visual presentations, and access both quantitative metrics and qualitative insights covering competitive analysis, market drivers, and distribution channels. The platform's scalability ensures it can adapt to different organizational requirements and budgets by offering different licenses and subscription levels while maintaining depth and reliability in quarterly updates.
Revision Date: December 2025
Datapoints: 80 Million+
Parametric Breakdowns: Year, Country, End-User Industry, Product Type, Purity Grade, Form Factor, Applications, Distribution Channels, Competitive Environment and more...
Companies Researched: 150+
Years Covered: 2004-2024 Actual, 2025 Estimate, 2026-2040 Forecasts
Delivery Method: Online Dashboards with Downloadable CSV Options Depending on License/Package

Dedalus Consulting's Data on Demand service provides fast, targeted market intelligence for organizations that need reliable data quickly and cost-effectively. This streamlined offering delivers pre-defined datasets focused on specific markets, geographies, or product categories, enabling rapid access to the essential intelligence required for time-sensitive business decisions without the investment required for comprehensive reports or full database subscriptions. Whether you're preparing a quick competitive brief, validating a market opportunity, supporting an internal presentation, or conducting preliminary due diligence, Data on Demand delivers the specific market metrics and insights you need. This flexible solution bridges the gap between broad industry overviews and exhaustive research projects, providing the strategic sweet spot for professionals who require trustworthy, independently verified market data on accelerated timelines.
Revision Date: December 2025
Datasets: 200+
Formats: XLS, CSV
Breakdowns: Year, Country, End-User Industry, Product Type, Purity Grade, Form Factor, Applications and more...
Years Covered: 2024 Actual, 2025 Estimate, 2026-2030 Forecasts

Dedalus Consulting's Market Essentials reports provide the fundamental intelligence that serves as the foundation for sound strategic planning at an accessible entry-level price point. Designed for organizations seeking core market understanding without the investment required for comprehensive multi-volume analysis, Market Essentials delivers the critical data and insights necessary to grasp industry fundamentals, competitive dynamics, and key market drivers. Each report distills decades of specialized expertise into focused analysis covering essential market sizing, major player identification, primary end-user segments, and significant trend trajectories—the cornerstones upon which effective business strategies are built. This streamlined approach makes professional-grade market intelligence accessible to smaller organizations, individual business units, or teams conducting preliminary market assessment before committing to deeper research investments.
Revision Date: December 2025
Pages: 25
Tables/Charts/Graphs: 50+
Years Covered: 2024 Actual, 2025 Estimate, 2026-2040 Forecasts
Parametric Breakdowns: Year, Country, End-User Industry, Product Type, Purity Grade, Form Factor, Applications and more...
Companies Researched: 150+
Delivery Method: PDF, Printable – Five (5) User License

Dedalus Consulting's Single-Client Consulting Services provide customized market intelligence tailored to the strategic challenges that standard research cannot address. With over 25 years of proven expertise serving manufacturers, end-users, financial institutions, and academic organizations in the germanium sector, we deliver the targeted competitive analysis essential for market expansion strategies, new product launches, regional market entry decisions, and merger and acquisition due diligence. Our consulting methodology distinguishes itself through primary research interviews with industry participants across the value chain—from manufacturers and distributors to end-users—combined with proprietary data accumulated through decades of continuous market tracking in specialty materials. This approach leverages deep industry relationships built over a quarter-century to surface operational insights and competitive intelligence that secondary research sources simply cannot provide. When standard market reports fall short of addressing your specific strategic requirements, Dedalus Consulting's Single-Client services deliver the precision intelligence that drives confident, informed business decisions in rapidly evolving technology markets.
Key Capabilities:
- Market Entry & Expansion Analysis — Comprehensive assessment of regional opportunities, competitive landscapes, distribution channel requirements, and go-to-market strategies tailored to specific geographic or segment expansion objectives
- Merger & Acquisition Due Diligence — In-depth target company evaluation including market position validation, competitive threat assessment, customer relationship analysis, and strategic fit evaluation backed by primary research and proprietary market data
- New Product Launch Intelligence — Market readiness assessment, competitive response forecasting, pricing strategy development, and distribution channel optimization to maximize launch success and accelerate market penetration
- Competitive Benchmarking & Strategic Positioning — Detailed analysis of competitor capabilities, market share dynamics, differentiation strategies, and vulnerabilities to identify sustainable competitive advantages and strategic opportunities
- Supply Chain & Sourcing Strategy — Comprehensive supplier landscape mapping, alternative sourcing identification, supply chain risk assessment, and strategic procurement intelligence leveraging deep industry relationships and market knowledge

Dedalus Consulting's Competitive Profiles deliver comprehensive intelligence on key industry players in the germanium market, providing the detailed competitive analysis essential for strategic positioning, M&A due diligence, and market entry decisions. Each profile offers an in-depth examination of a company's competitive standing within the specialty materials industry, combining quantitative performance metrics with qualitative strategic assessment to reveal competitive strengths, vulnerabilities, and market trajectories. Our analyses include detailed breakdowns of sales performance and market share by product type, geographic region, and end-user segment, alongside examination of distribution channel strategies, manufacturing capabilities, technology portfolios, and go-to-market approaches. Key performance indicators cover revenue trends, profitability metrics, capacity utilization, R&D investment patterns, and product mix evolution, while competitive positioning analysis evaluates differentiation strategies, pricing power, customer relationships, and supply chain advantages.
Key Intelligence Components:
- Sales Performance & Market Share Analysis — Detailed revenue breakdowns by product line, geographic region, end-user segment, and distribution channel, with historical trends and market share positioning across specific industrial segments
- Strategic Positioning Assessment — Comprehensive evaluation of competitive differentiation strategies, pricing power, technology portfolios, manufacturing capabilities, and go-to-market approaches that define each company's competitive advantage
- Distribution & Channel Strategy Analysis — In-depth examination of sales channel mix, distributor relationships, direct sales capabilities, customer service infrastructure, and route-to-market effectiveness across geographic markets
- Financial & Operational Metrics — Key performance indicators including revenue trends, profitability analysis, capacity utilization, R&D investment patterns, product mix evolution, and operational efficiency benchmarks validated through primary research
- Competitive Strengths & Vulnerabilities — Strategic intelligence on management capabilities, innovation pipelines, customer relationships, supply chain advantages, technology gaps, and market positioning weaknesses that impact long-term competitive sustainability
